If you've ever scrolled through a folder of 500 samples trying to find 'that kick drum that sounds like the one in the track I was working on yesterday,' SoundMap is for you. It plots every sample on a 2D canvas based on what it actually sounds like, not what it's named. Similar sounds cluster together. You can see your library at a glance, click to preview, and find what you need in seconds.
This guide covers the SoundMap tab in GreenGo 2.0.4, from loading your first folder to exporting MIDI gestures.
What Is SoundMap?
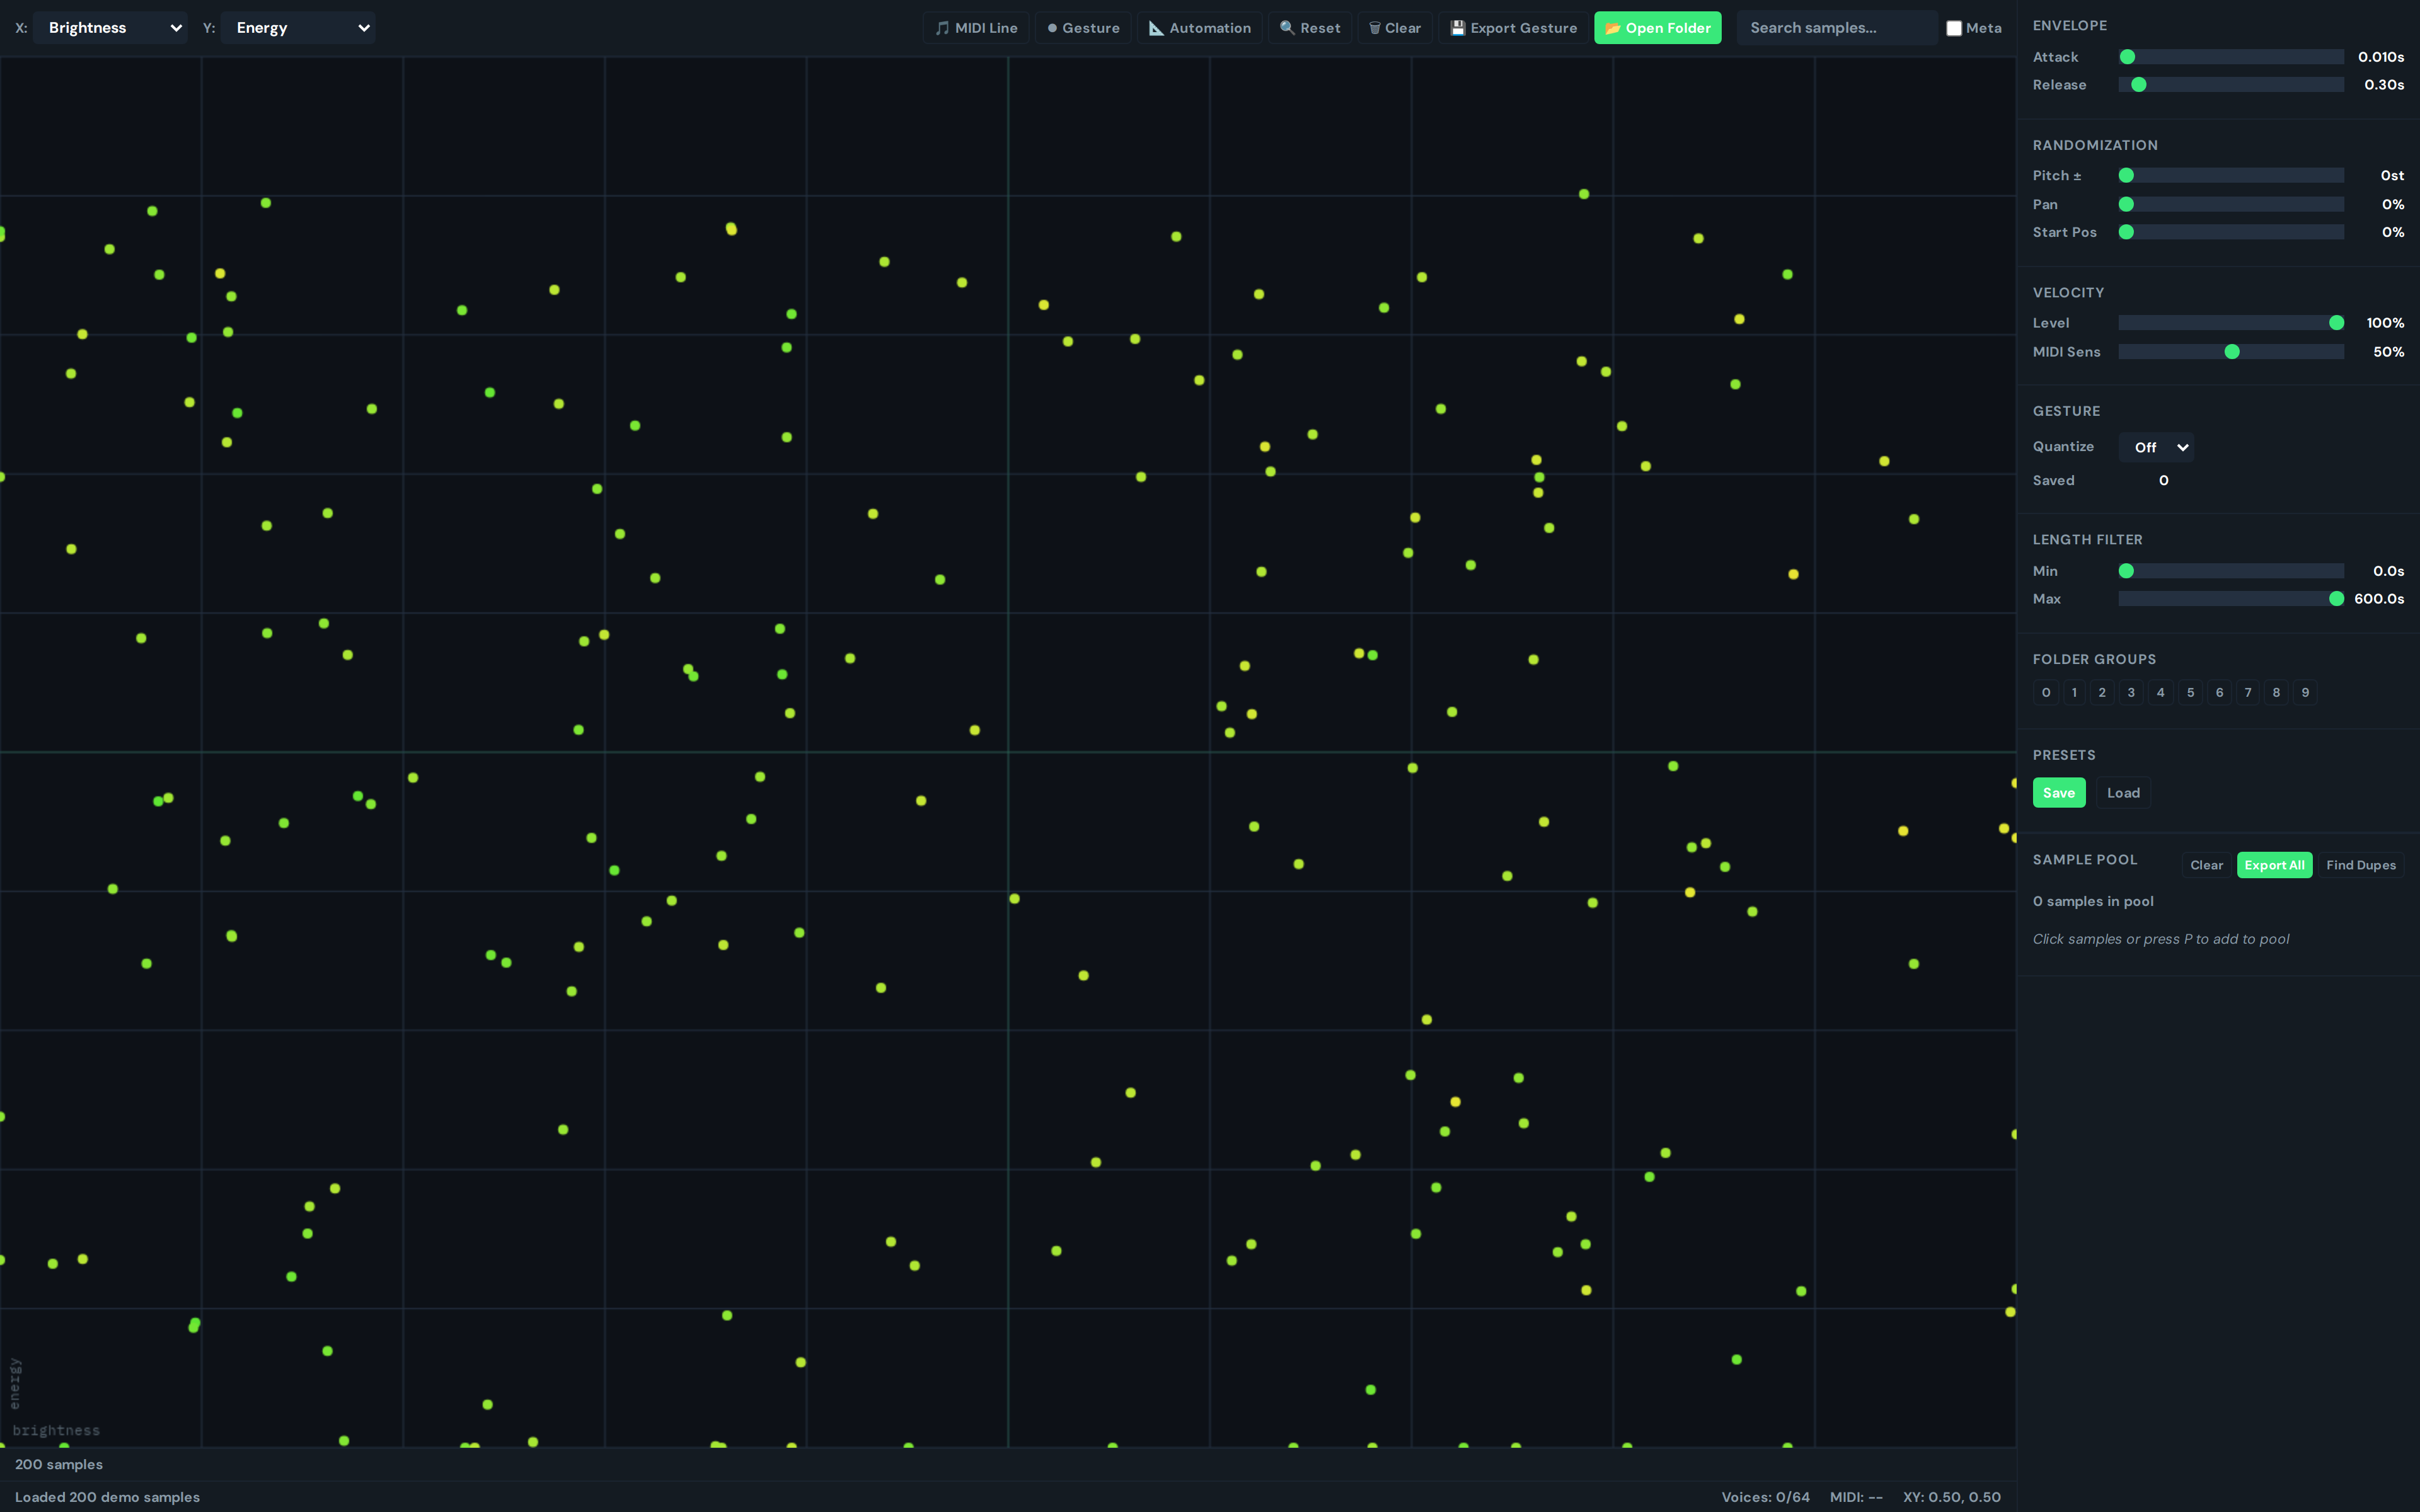
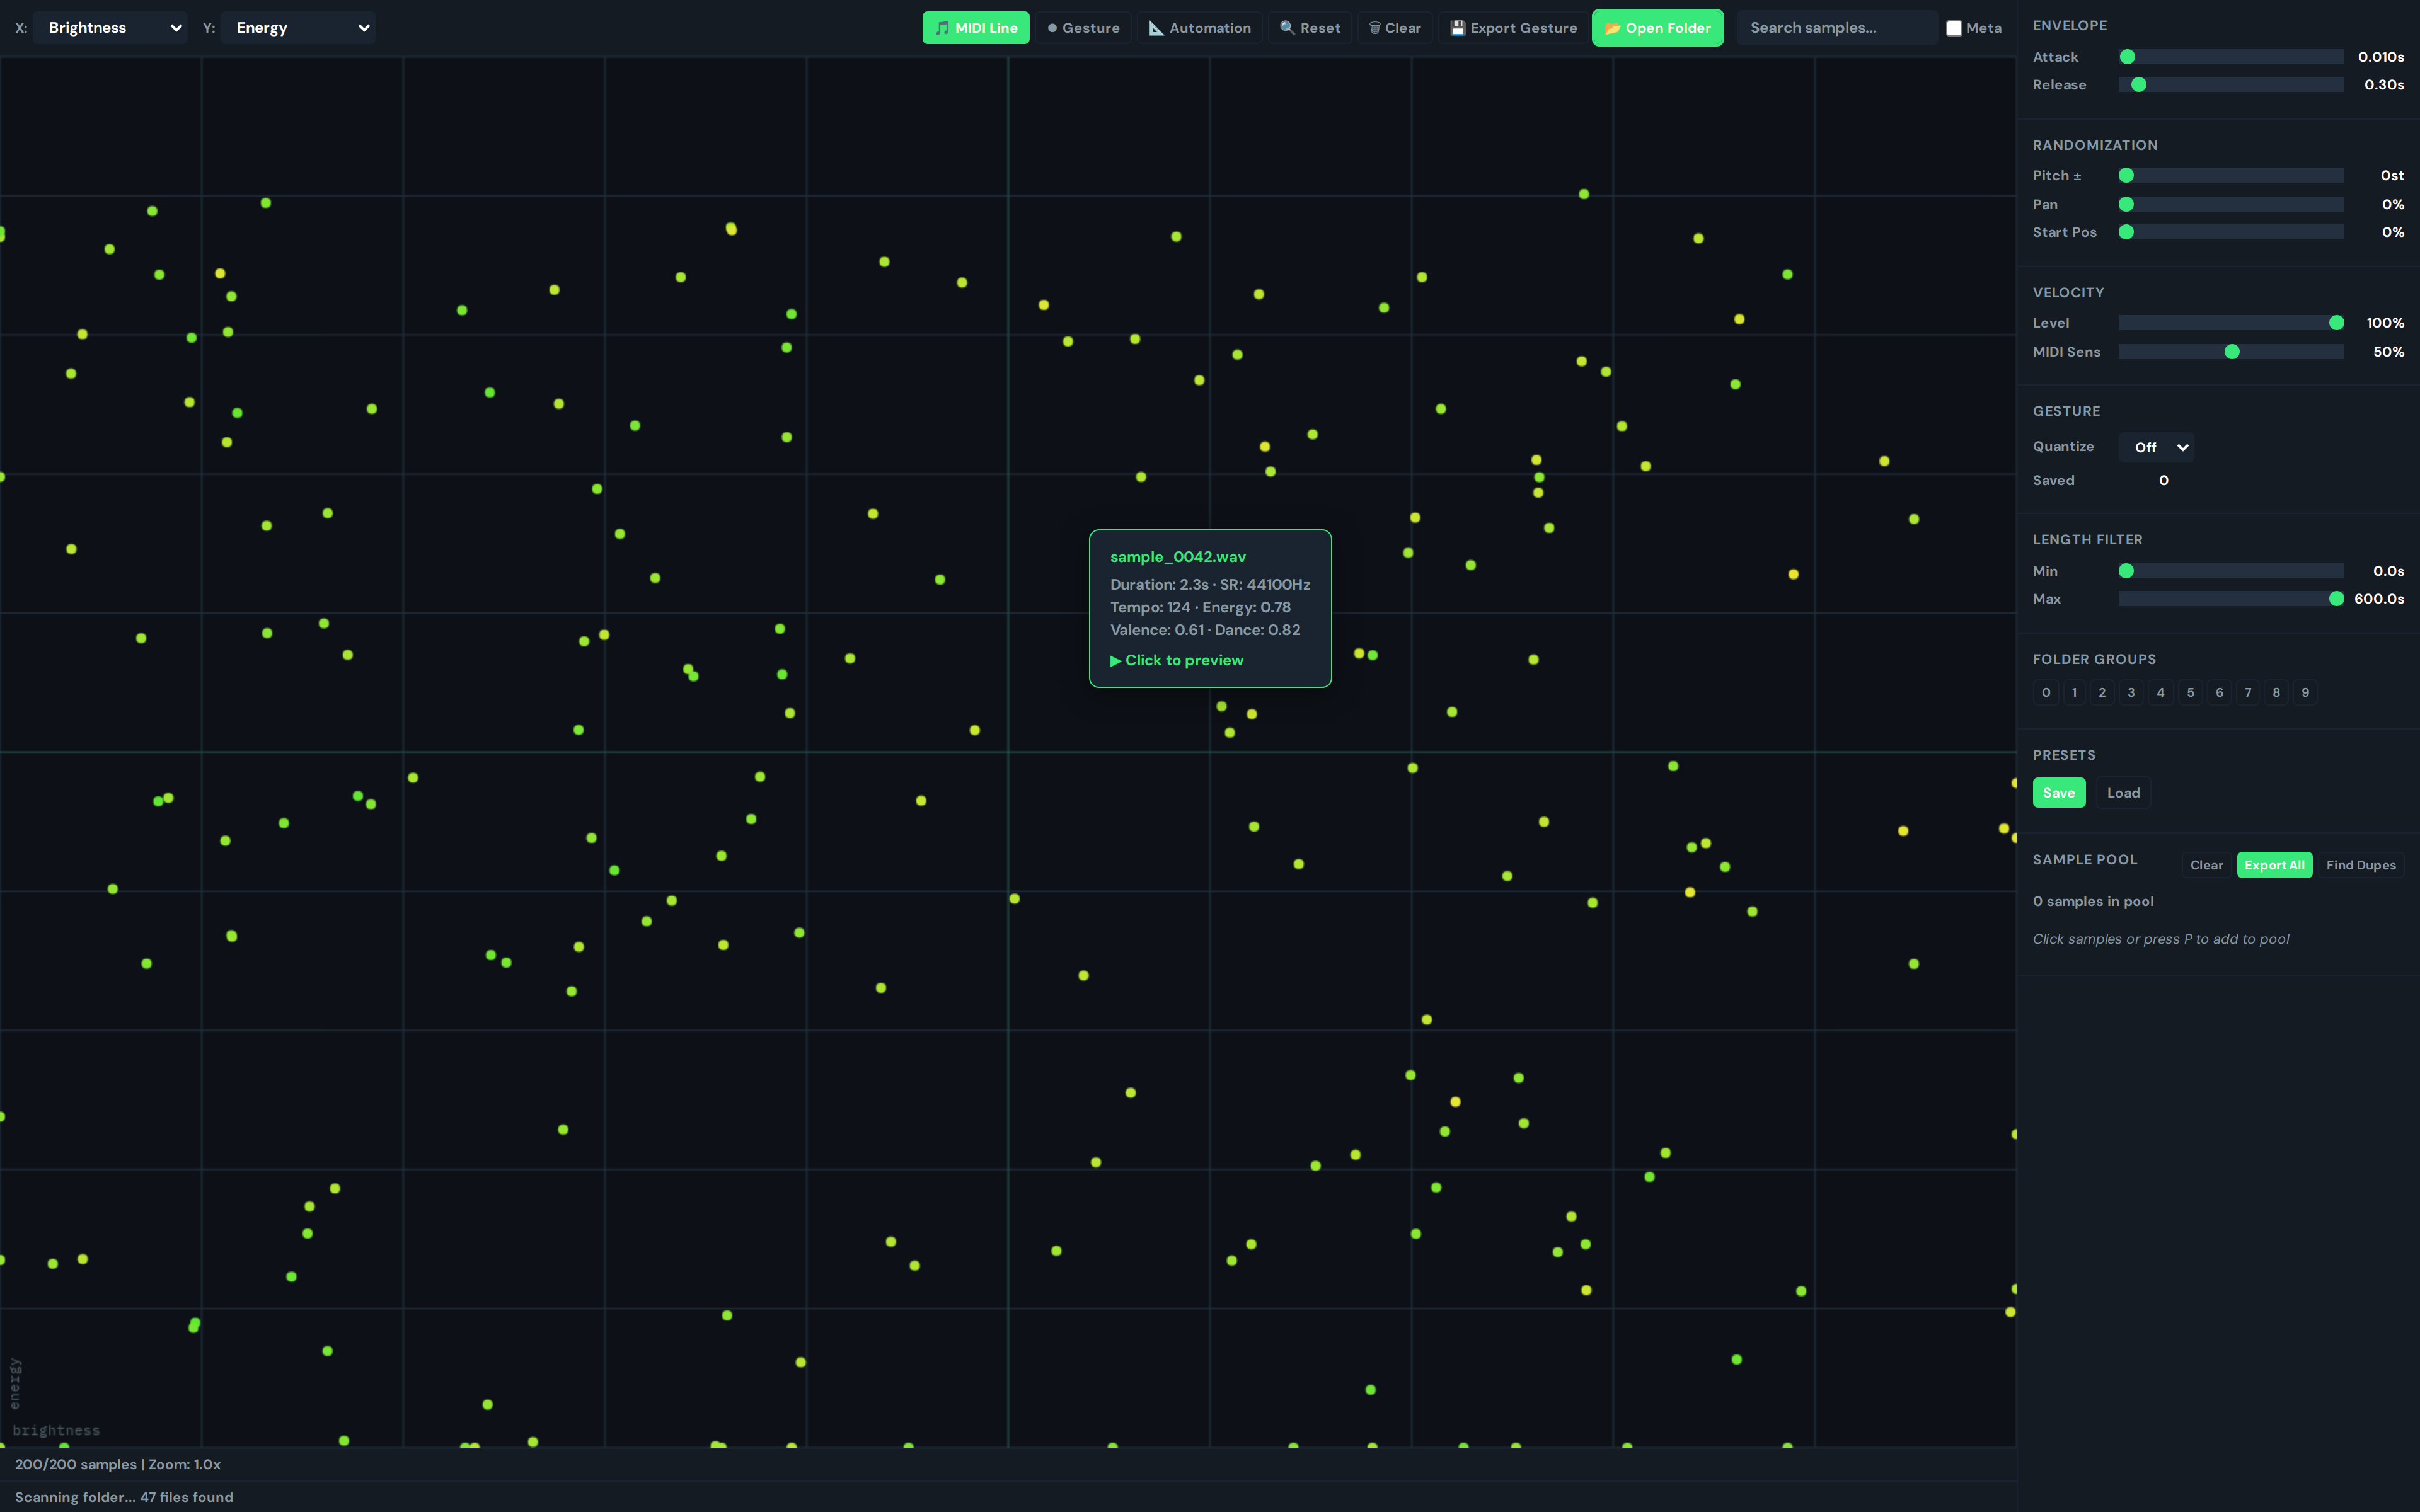
SoundMap is an interactive scatter plot that visualizes audio files based on their acoustic features. Instead of browsing samples by filename or folder structure, you see them positioned in a 2D space where similar-sounding samples appear close together.
GreenGo extracts 10 features from each audio file: brightness, energy, pitch, duration, zero crossings, spectral flux, MFCC 1, MFCC 2, roughness, and noisiness. You choose which two features to plot on the X and Y axes. The result is a map of your library where you can visually identify clusters, outliers, and duplicates.
Loading Your Sample Library
There are two ways to load samples into SoundMap:
Method 1: Open Folder
- Click the 'Open Folder' button (folder icon) in the toolbar
- Select a folder containing audio files
- GreenGo recursively scans the folder for audio files
- WAV files are analyzed using Node.js (fastest)
- Other formats (MP3, FLAC, OGG, M4A, etc.) are analyzed in-browser via the Web Audio API
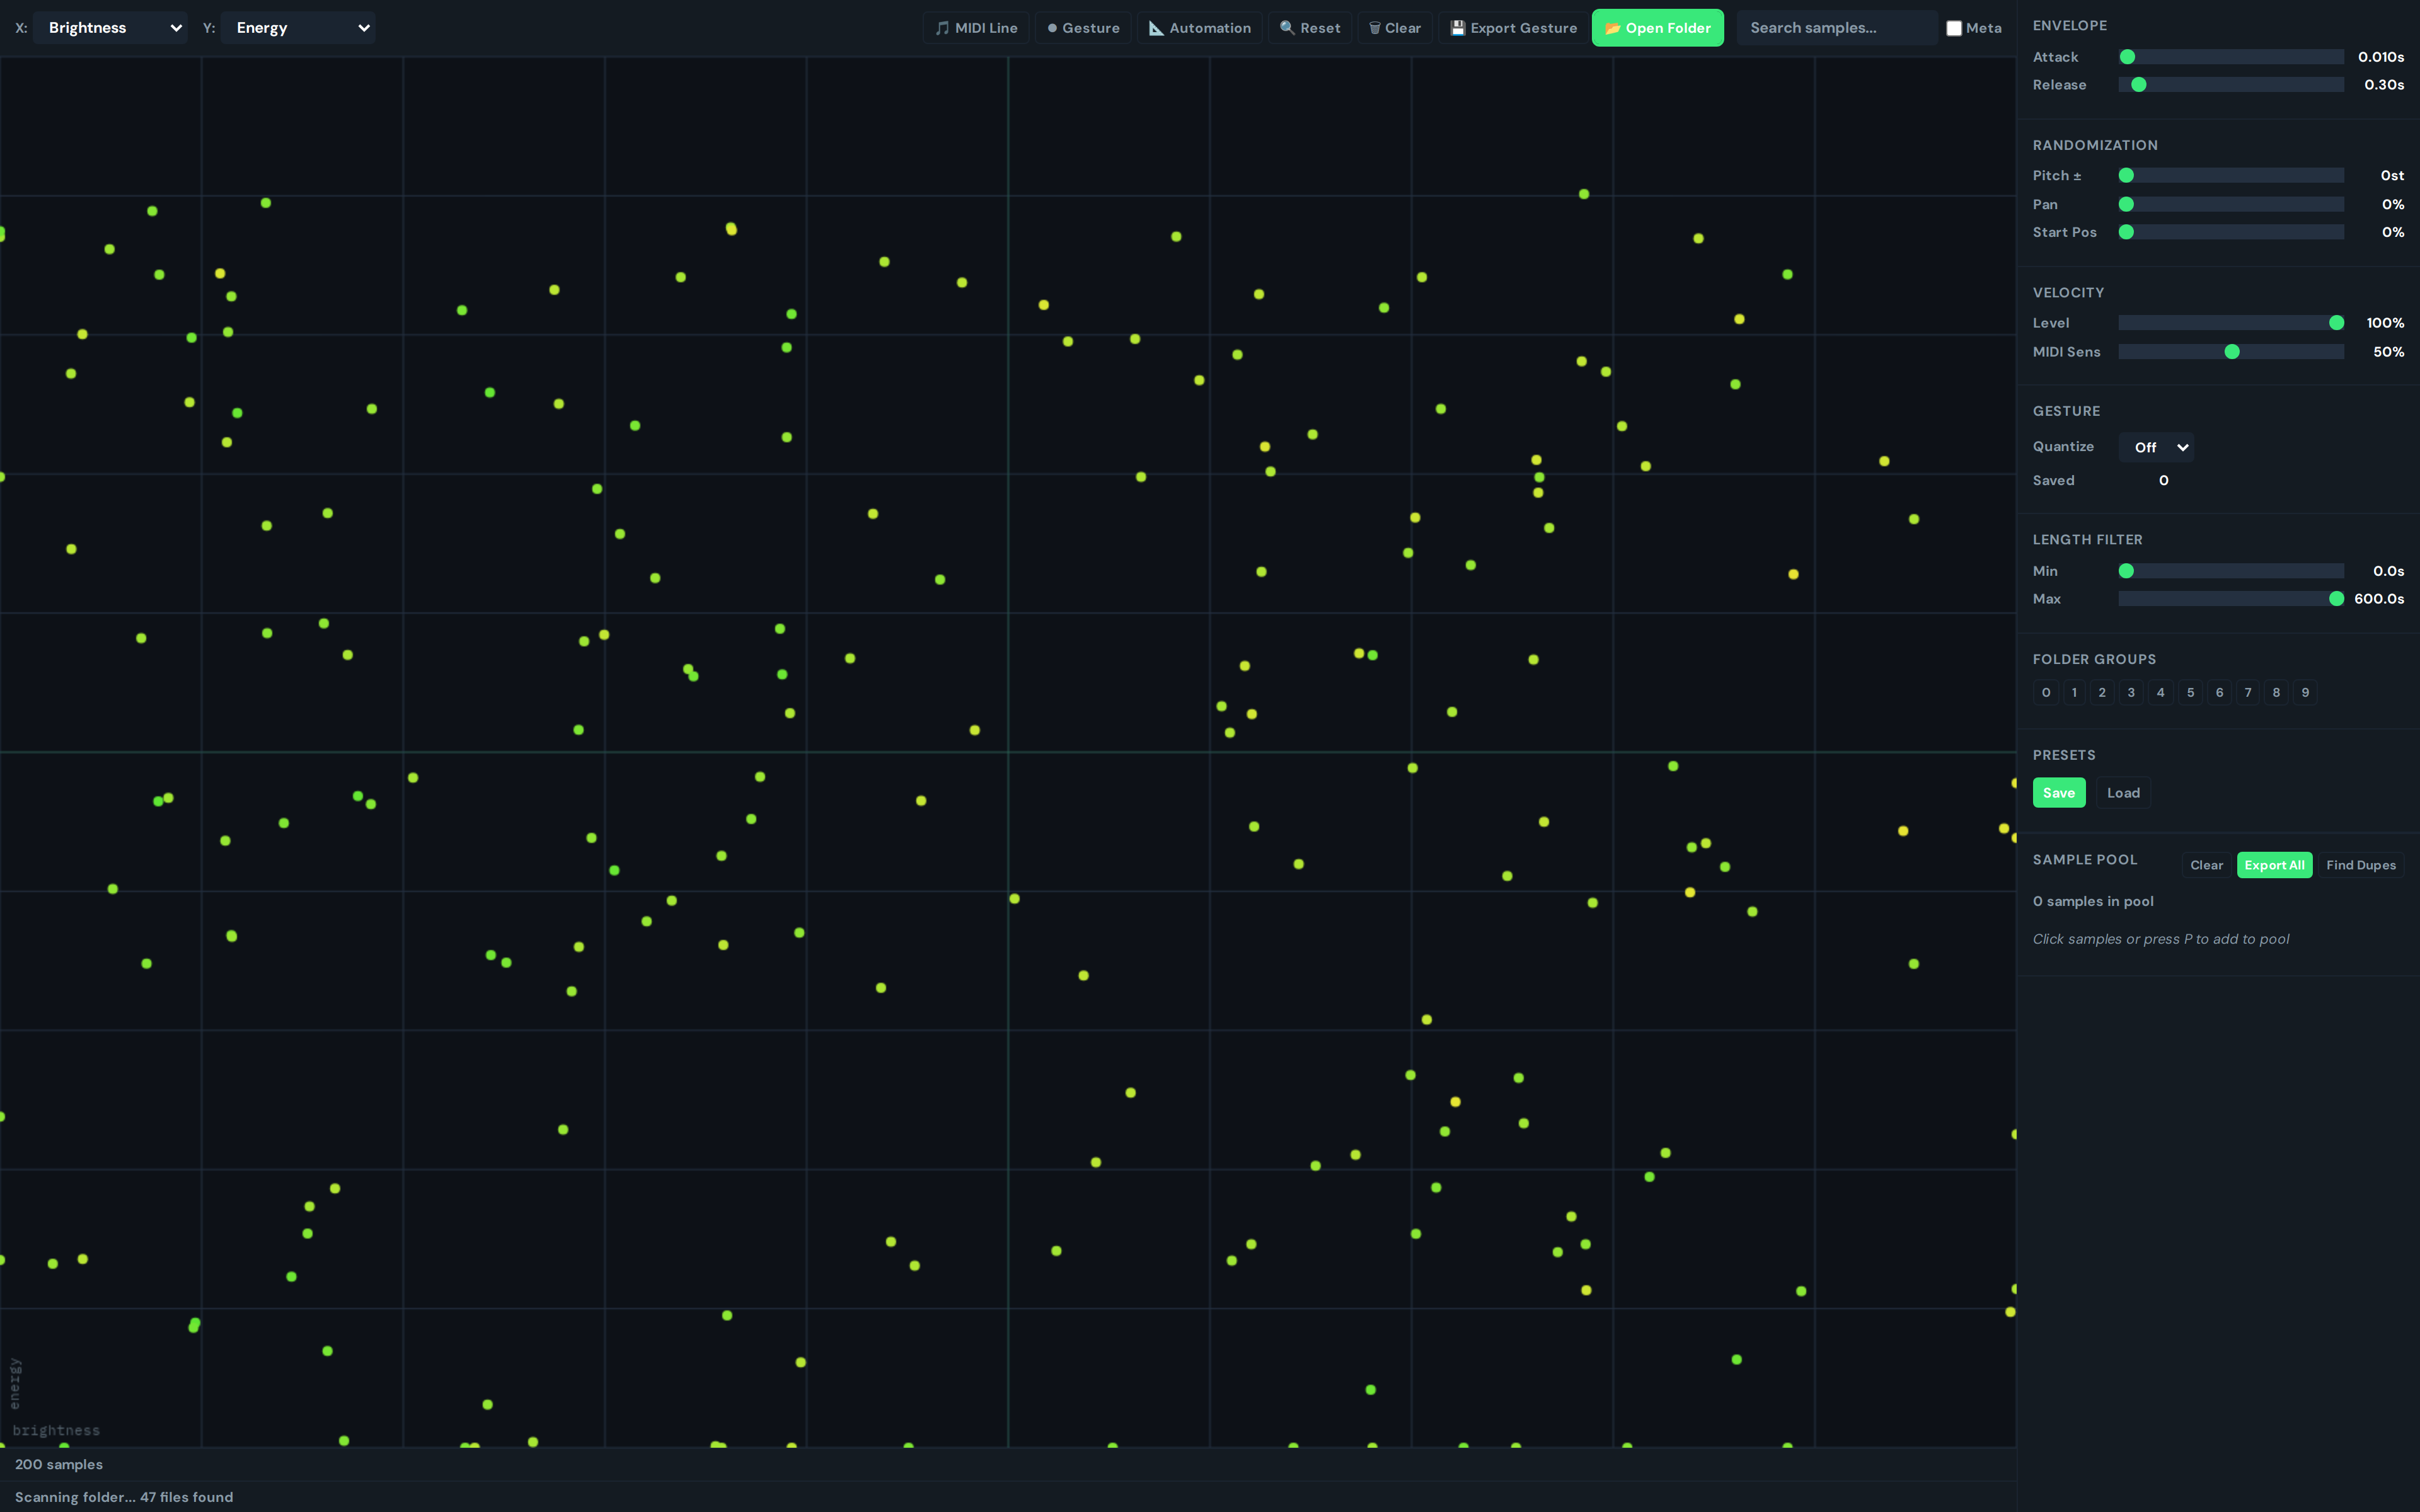
- The status bar shows 'Analyzing X samples...' during loading
- When complete, samples appear as dots on the scatter plot
Supported formats: WAV, MP3, OGG, FLAC, AIFF, M4A, AAC, WMA
Method 2: Drag & Drop
Drag audio files from your file manager directly onto the SoundMap canvas. They're analyzed and added to the existing samples on the plot.
Performance note: Only the first 1MB of each file is read for analysis, and 8192 samples from the start of the audio are used. This makes loading fast even for large libraries, but means the analysis focuses on the attack/initial transient of each sample.
Understanding the 10 Audio Features
You can plot any two of these 10 features on the X and Y axes. Use the dropdown selectors at the top of the scatter plot to change axes:
| Feature | What It Measures | Low Value | High Value |
|---|---|---|---|
| Brightness | High-frequency content (zero-crossing rate) | Dark, muffled | Bright, airy |
| Energy | Overall loudness (RMS) | Quiet, subtle | Loud, punchy |
| Pitch | Fundamental frequency (50-2000 Hz, log scale) | Low pitch | High pitch |
| Duration | Sample length (log scale, 30s = 1.0) | Short (transient) | Long (sustained) |
| Zero Crossings | Waveform zero-crossing rate | Low frequency content | High frequency content |
| Spectral Flux | How much the spectrum changes over time | Steady, sustained | Dynamic, transient |
| MFCC 1 | Mel-frequency cepstral coefficient 1 (mirrors energy) | Low energy timbre | High energy timbre |
| MFCC 2 | Mel-frequency cepstral coefficient 2 (mirrors brightness) | Dark timbre | Bright timbre |
| Roughness | Dissonance/harshness (second-order differences) | Smooth, clean | Rough, harsh |
| Noisiness | Noise vs tonal content (1 - periodicity) | Tonal, pitched | Noisy, percussive |
Default axes: X = Brightness, Y = Energy. This gives a good overview: dark/quiet samples in the bottom-left, bright/loud samples in the top-right.
Recommended axis combinations:
- Brightness vs Energy: General timbral overview
- Pitch vs Noisiness: Separate tonal samples from percussive ones
- Duration vs Spectral Flux: Separate sustained sounds from transients
- Roughness vs Brightness: Find harsh vs smooth sounds at each brightness level
Navigating the Scatter Plot
The scatter plot supports standard canvas navigation:
- Scroll to zoom: Zoom in/out centered on cursor position
- Click and drag: Pan around the plot when zoomed in
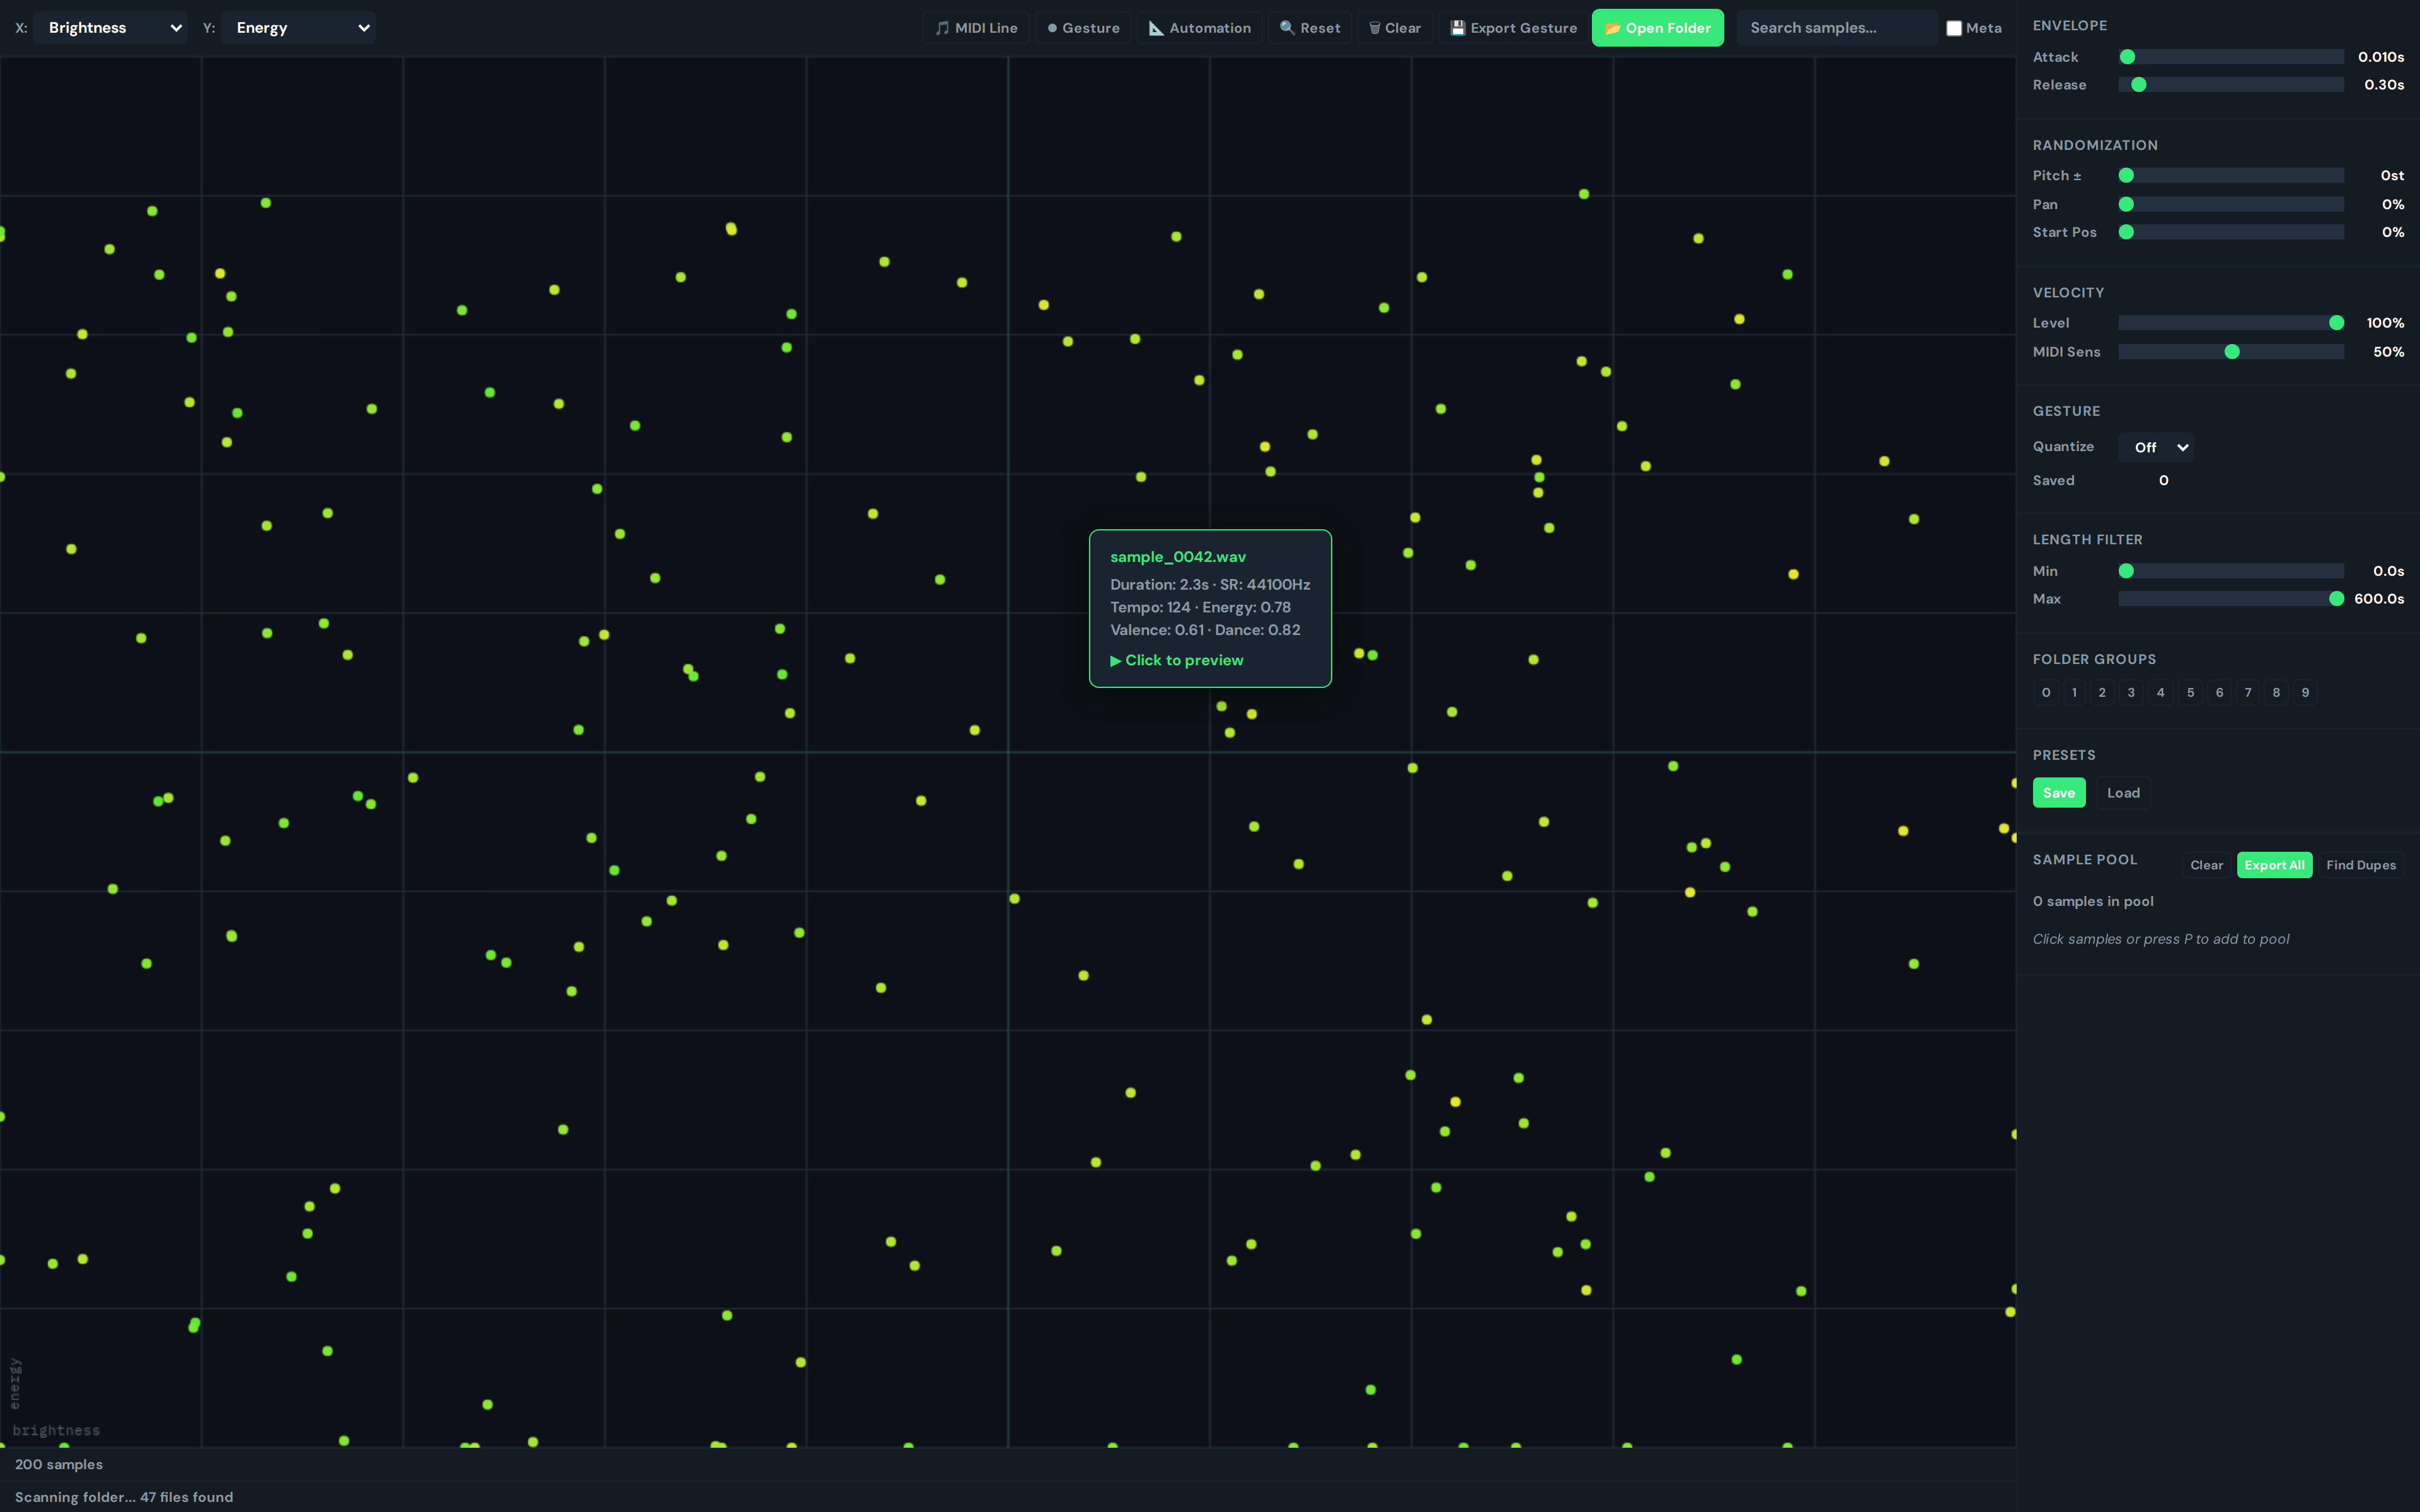
- Hover: Tooltip shows sample name and feature values
- Click: Select a sample (highlighted on the plot)
- Reset button: Reset zoom and pan to default view
- Clear button: Remove all samples from the plot
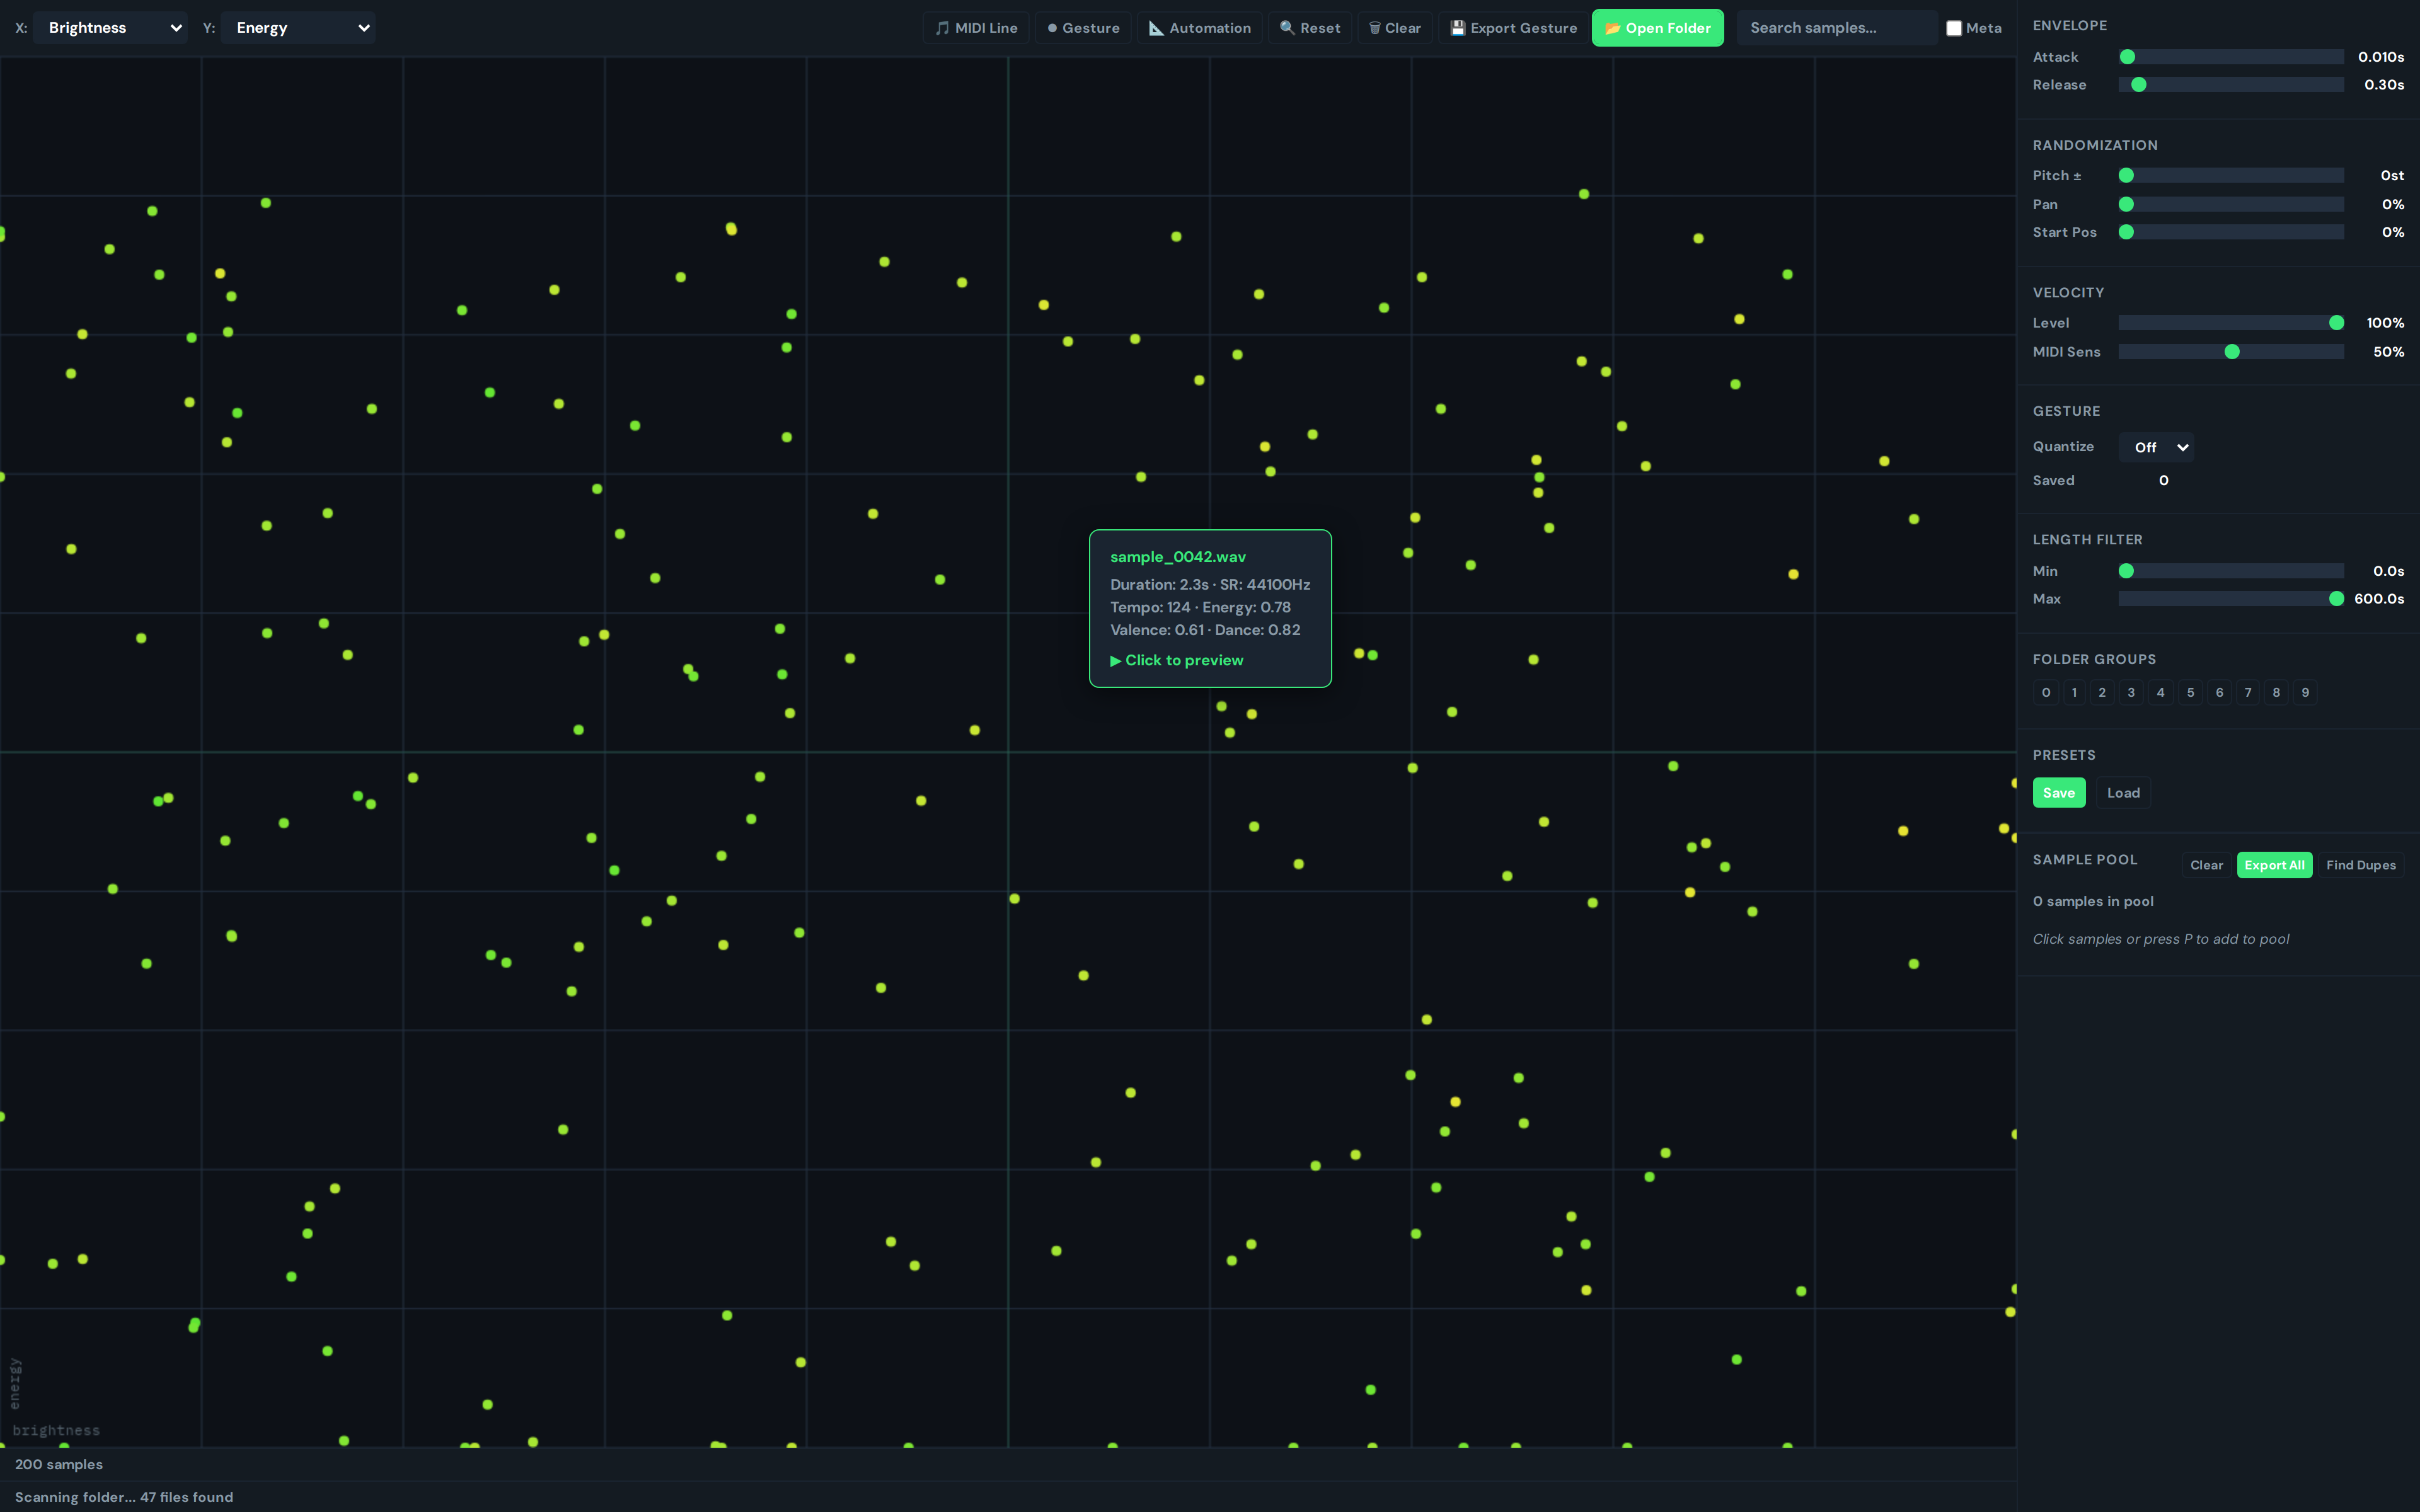
The status bar at the bottom shows real-time information:
- Sample count ('247 samples')
- Hover info (sample name on hover)
- Voice count ('Voices: 3/64')
- Cursor position ('XY: 0.50, 0.50')
- MIDI device status
Auditioning Samples
You can preview any sample directly from the scatter plot:
- Click a dot to select it
- Click again (or press the play button in the sample pool) to preview it
- The sample plays through your default audio output
- Press Space to stop all playing samples
The audio engine supports 64-voice polyphony, so you can trigger multiple samples simultaneously. Audio buffers are cached after first load for instant playback.
Envelope controls (right sidebar):
- Attack: 0.001s - 2s (how quickly the sample fades in)
- Release: 0.01s - 2s (how quickly the sample fades out when released)
Randomization controls (right sidebar):
- Pitch: +/- semitones (random pitch variation per trigger)
- Pan: Stereo pan randomization
- Start Position: Random start point within the sample (%)
These controls let you audition samples with variation, which is useful for testing how a sample holds up under different conditions.
Building a Sample Pool
The Sample Pool is your personal collection of selected samples. Here's how to use it:
- Add to pool: Select a sample on the plot and press P, or use the add button
- Favorite: Press F on a selected sample to mark it as a favorite (star icon)
- Remove: Use the remove button in the pool list
- Play: Use the play button next to each pool entry
- Clear: Clear the entire pool
- Export: Export the pool (paths) for use in other tools
Finding Duplicate Samples
If your sample library has grown over years of downloading packs, you probably have duplicates. SoundMap's duplicate detection finds two types:
- Exact duplicates: Same filename (shown in red)
- Timbral duplicates: Similar audio features (feature distance < 0.05, shown in yellow)
Click 'Find Dupes' in the Sample Pool panel to run detection. Results show grouped duplicates with a remove button for each. This is one of the fastest ways to clean up a bloated sample library.
MIDI Controller Integration
SoundMap works with MIDI controllers via the Web MIDI API:
- Connect a MIDI controller to your computer
- SoundMap detects it automatically (status bar shows device name)
- MIDI notes trigger samples based on their X-axis position
- Higher notes trigger samples further right on the X-axis
- Velocity affects sample volume
Velocity sensitivity is adjustable (0-100%) in the Velocity panel. Loop detection automatically identifies if you're playing a repeating pattern (2-second window).
Gesture Recording and MIDI Export
SoundMap can record your mouse movements on the scatter plot as 'gestures' and export them as MIDI files:
- Click the Gesture button (circle icon) to start recording
- Click and drag on the canvas to draw a path
- Click Gesture again to stop recording
- The gesture is saved to the gesture list
- Choose a quantization setting (Off, 1/4, 1/8, 1/16, 1/32 notes)
- Click Export Gesture to save as a MIDI file
The MIDI file maps your drawn path to notes: the X position at each point determines the pitch, and the timing of your drawing determines the rhythm. This is a creative way to generate melodic sequences from your sample library.
MIDI Line mode is a related feature: click 'MIDI Line' to draw a straight line across the canvas. MIDI notes map to positions along the line, useful for melodic sequencing across a specific range of your sample library.
Saving and Loading Presets
You can save your current SoundMap configuration as a preset:
- Click Save in the Presets panel
- Name the preset
- The preset saves: current axes, zoom level, pan position, envelope settings, randomization settings, and velocity
- To reload, click Load and select a preset from the list
Presets are stored as JSON files in your app data directory. You can delete presets from the list.
Frequently Asked Questions
Does SoundMap detect BPM or musical key?
No. SoundMap extracts timbral features (brightness, energy, pitch, roughness, etc.) for sound design purposes. It does not detect BPM or musical key. For BPM and key detection, use the Analyze tab. SoundMap is designed for sample library organization, not DJ harmonic mixing.
How many samples can SoundMap handle?
SoundMap can handle hundreds of samples on the scatter plot. Performance depends on your machine, but canvas-based rendering is efficient. Very large libraries (1000+) may take a few minutes to analyze on first load.
What audio formats are supported?
WAV, MP3, OGG, FLAC, AIFF, M4A, AAC, and WMA. WAV files are analyzed fastest (Node.js native analysis). Other formats are analyzed in-browser via the Web Audio API, which is slightly slower but produces the same feature values.
Can I use SoundMap without a MIDI controller?
Yes. MIDI is optional. You can click samples to preview them, build a sample pool, detect duplicates, and export gestures as MIDI without any hardware. MIDI controller support is a bonus for live performance and experimentation.
Does SoundMap work offline?
Yes. All feature extraction and visualization runs locally on your machine. No internet connection needed.
Can I edit sample metadata in SoundMap?
No. SoundMap is for visualization and auditioning only. To edit metadata, send files to the Metadata tab via the File Manager.